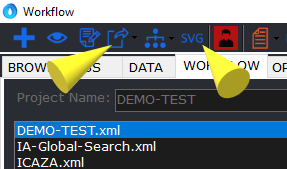
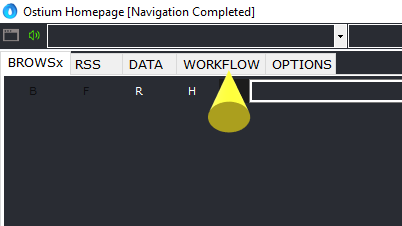
After opening Ostium Browser click on the Workflow tab.
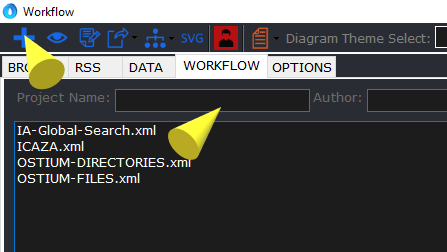
Then, in the menu, click on the Create new project button and choose a project name.
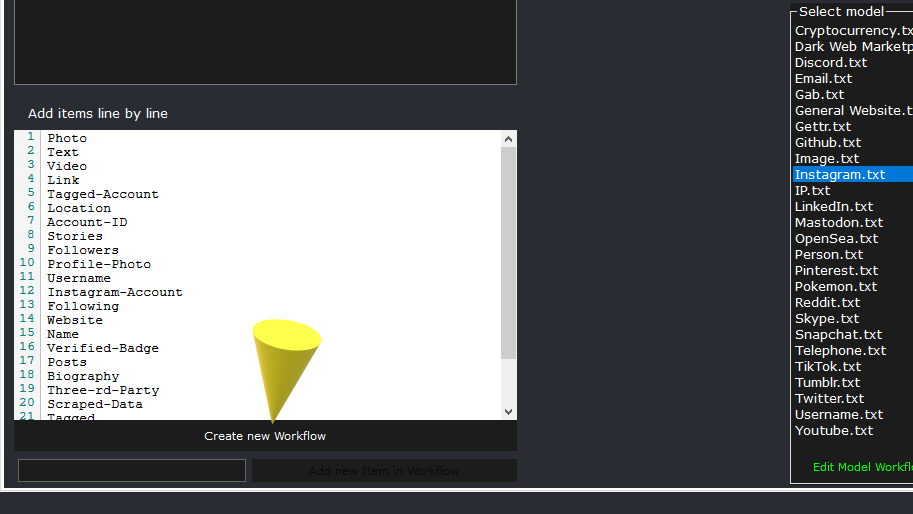
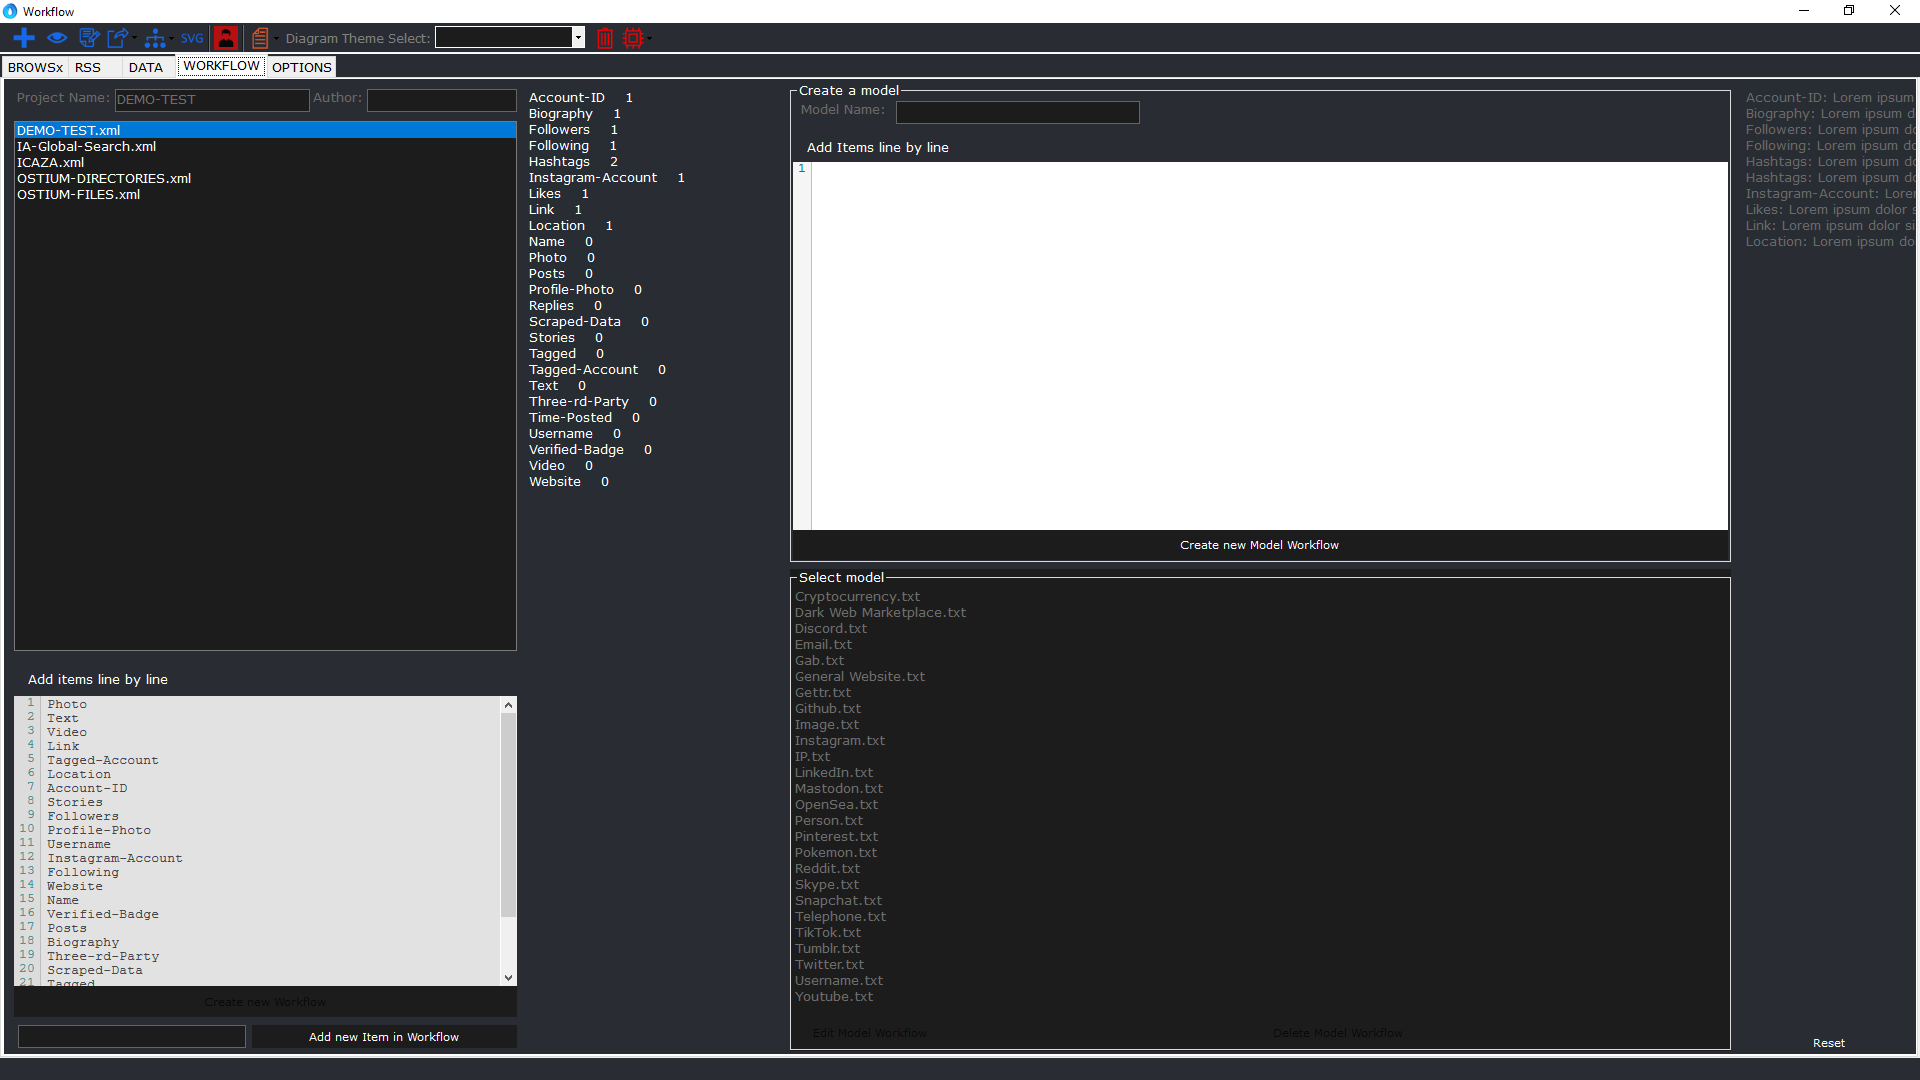
You can either add what you’re looking for as a data type (A) or use a predefined model (B). In this example, I’ll use the Instagram data model.
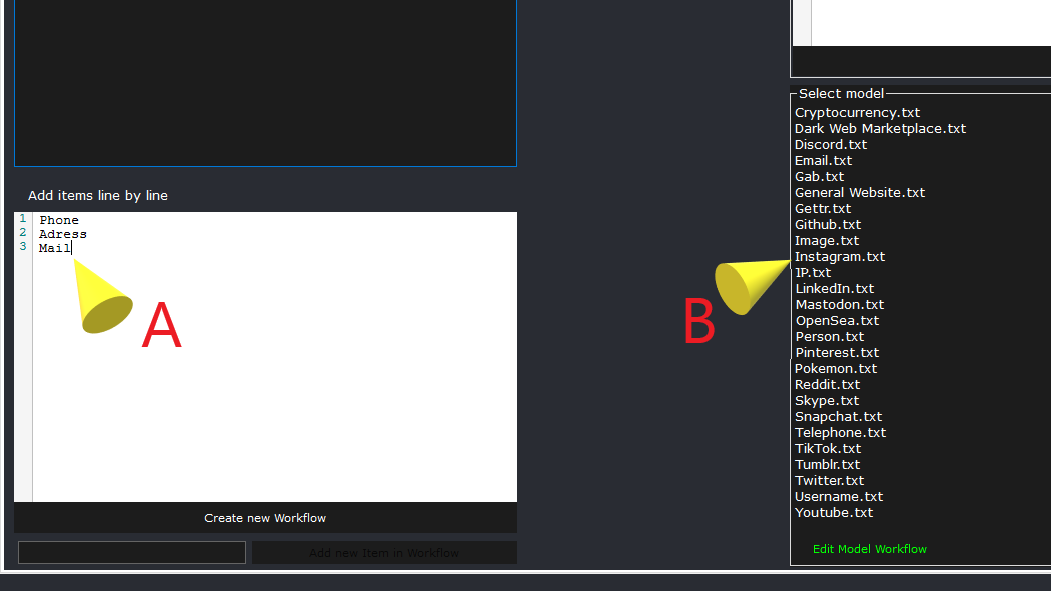
You can now click on the Create new workflow button.
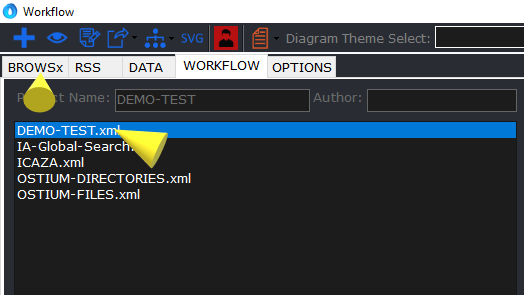
Now that the new project has been created, select it from the list and click on the Browsx tab.
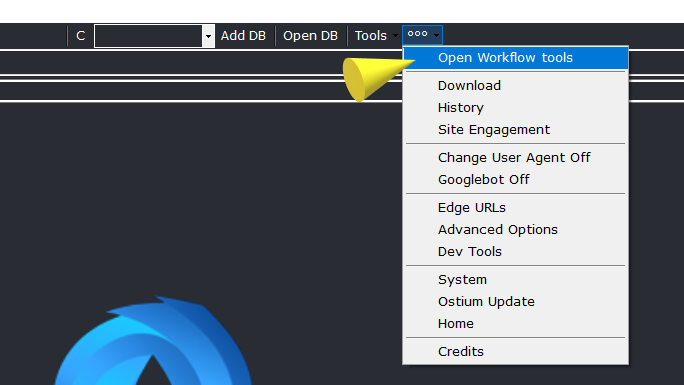
Then click on Open Workflow Tools in the Menu.
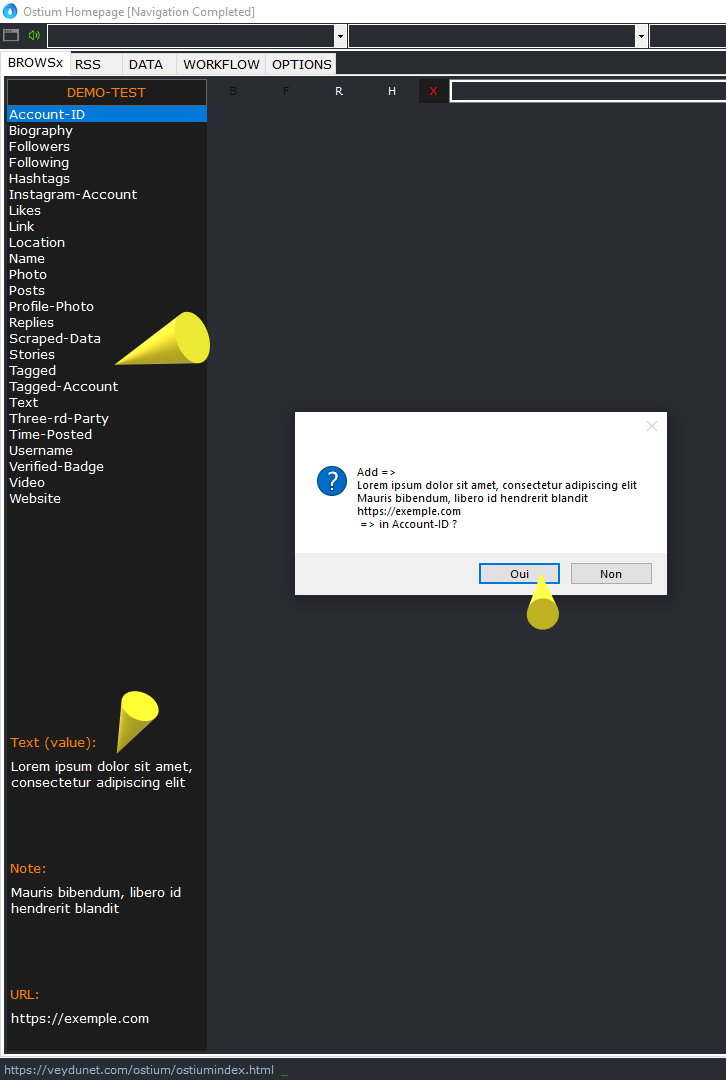
On the left you’ll find the various Items you’ve added, along with 3 textbox in which to add the data you’ve collected.
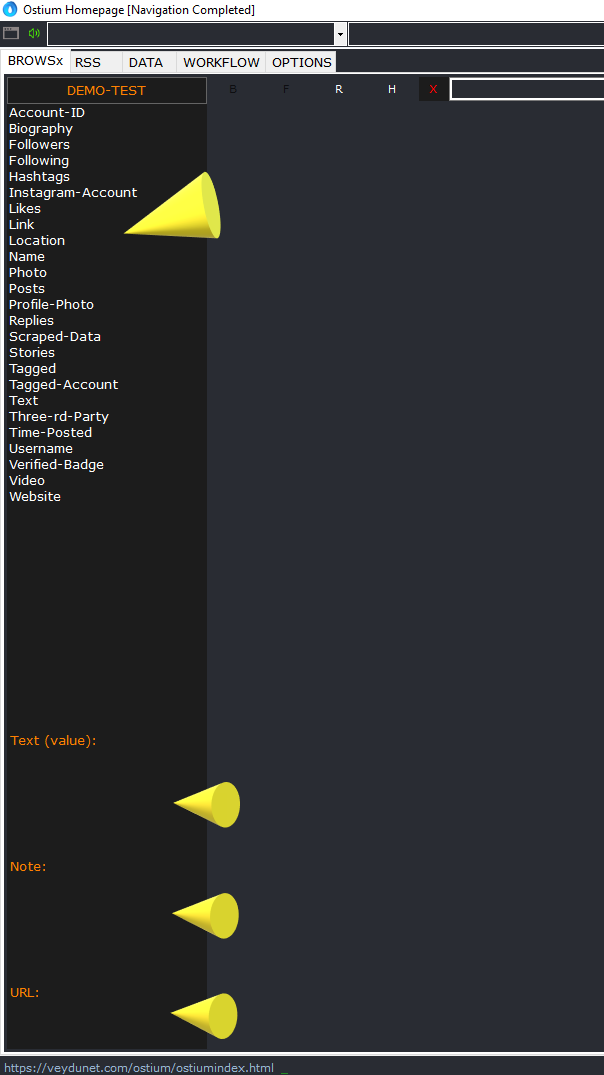
Add the data collected in the various textbox and then click on the item in the list to which you wish to add the data and confirm the addition.
When you’ve finalized the data collection you can return to the Workflow tab. (In this example, I haven’t filled in all the items).
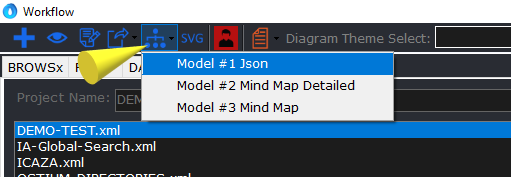
To create a digram of the data collected, click on the button in the Create a diagram menu and choose from 3 types of diagram: Json, Detailed Mindmap and Mindmap. When the diagram is ready, it is displayed automatically.
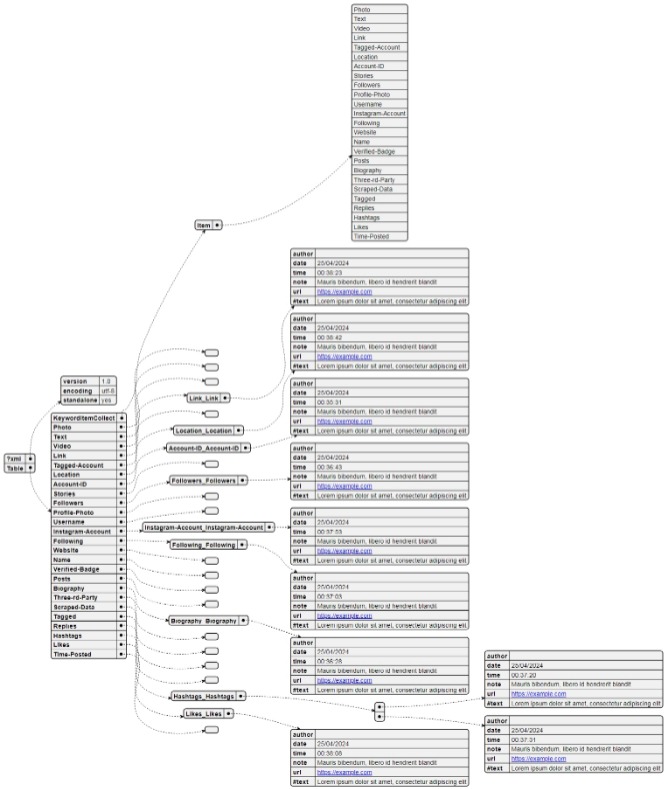
Here’s the result for a Json diagram. see SVG file
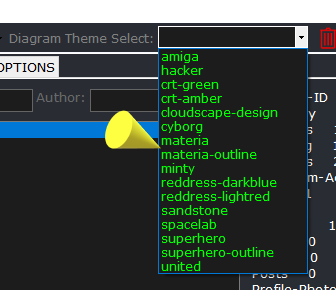
You can choose different themes for your diagram from the menu.
Click on the SVG button to export your diagram in SVG format. You can also export your project in XML and Json format.